Error Log view for output messages
The Error Log →view captures all the events (e.g. warnings, errors) logged by →features.
All events are saved to an underlying file .log.
The Error Log view is visible, if you start Neuron Power Engineer for the first time or open one of the →perspectives for application creating or application testing.
If the Error Log view is not visible in your application, you can add it to the current perspective: Select Window – Show View – Error Log.
| In this article: |
|---|
Components of Error Log
Columns in view
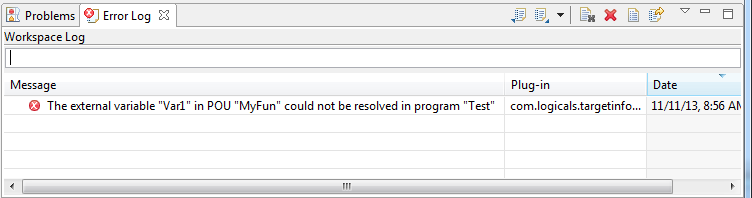
The following columns are visible within Error Log:
-
Column Message displays an icon indicating the type and the actual text of the event.
The following icons might be displayed in Error Log:Icon
Type

information

warning

error
-
Column Plug-in provides the name of the plug-in containing the event.
-
Column Date indicates the date and time when the event has occurred.
Context menu and toolbar for view
Right-clicking inside the view opens a context menu. Moreover, the view provides a toolbar with buttons. The context menu as well as the buttons allows you to perform actions. See the following section for a list of possible actions.
Actions for Error Log
Sorting events
Events in Error Log can be sorted by column Message, Plug-in ID or Date in ascending or descending order:
-
Click the column header that you want the sorting to be based on.
Result: in the column header indicates the descending order,
  indicates the ascending order.
 -
If you need to activate the other order type: Click on the column header again.
Grouping events
Events in Error Log can be grouped by Session, Plug-in ID or not at all:
-
Click
 in toolbar of Error Log, select Group By and one of the provided commands.
Filtering events
You can filter the view to show events with a particular text only:
-
Enter the filter text into the box displayed above the columns and press the Enter-key.
If there is no box to enter the filter text, have it displayed: Click in toolbar of Error Log and select Show text filter.
You can filter the view to show events of a particular type or session as well:
-
Click
in toolbar of Error Log and select Filters... -
In the dialog, check the filtering options you want to show. You can also limit the number of entries in the view.
Importing log
-
Click button
 in toolbar of Error log or select Import Log... from the context menu.
 -
In the dialog, select a file with extension .log from the file system.
Exporting current log
-
Click button
 in toolbar of Error Log or select Export Log... from the context menu.
 -
In the dialog, enter a file name.
Clearing/deleting log
To clear the view log content without deleting the underlying file .log:
-
Click button
 in toolbar of Error Log or select Clear Log Viewer from the context menu.
To permanently delete the underlying file .log:
-
Click button
 in toolbar of Error log or select Delete Log from the context menu.
Viewing event details
-
Double-click on a particular event or select Event Details from the context menu of that event.
-
In the dialog, view the full details of the event (e.g. date, severity, message).
-
If required: Navigate from one event to the next by clicking button
 or
or  .
. -
If required: To copy the event to the clipboard, click button
 .
.