Debugging application in perspective "Debug"
How to debug the application for the project
Open the →perspective Debug.
 If warnings with Enablement expression will be displayed in the error log, ignore them. See "Warnings 'Enablement expression' when debugging an application" for details.
Opening the perspective for C debugging: In the project explorer, open the context menu for the project, point to Debug As and select the following command (depending on the PLC):
PLC/target
Command
built-in PLC
Instant C Debugging
Alternative: Select the project within the project explorer or select the configuration, the resource or the program instance within the Instances view. Then click
 in the toolbar. A dialog is opened when starting the debugging session for the first time (for each workspace). In this dialog, select Use configuration specific settings and GDB (DSF) Create Process Launcher from the list of launchers, then click OK.
remote target systems
the command with the name as created because of the steps for "Launch-Konfiguration für Remote-Zielsysteme erstellen"
Opening the perspective for ST/FBD debugging: In the Instances view, open the context menu for a resource and select the command Start Debugging . In order to provide a feedback on the debugging state, the resource is highlighted accordingly in the Instances view (see "Starting the perspective for ST/FBD debugging" for details).
If required: Click Yes when your are prompted to switch to the perspective Debug.
This perspective provides insights into execution of the application loaded onto the PLC (e.g. because of the Variables view). If views of the perspective are not visible but needed, reset the perspective to its original layout or open the views as described under "Opening views/editors".Perform one of the following steps depending on the code used for the debugging session:
For C debugging: In menu Run, select Resume. Alternative: Click
 in the toolbar.
Result: The application is executed until the set →breakpoint is hit.For ST/FBD debugging: The application has already been suspended at the set →breakpoint. In the Debug view, select the element of the call hierarchy for which the execution has been suspended.
Example: This element is here: Counter() at program.iecst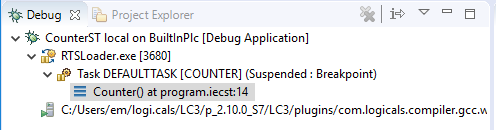
In the Variables view, check the current values of the variables. Example for display:
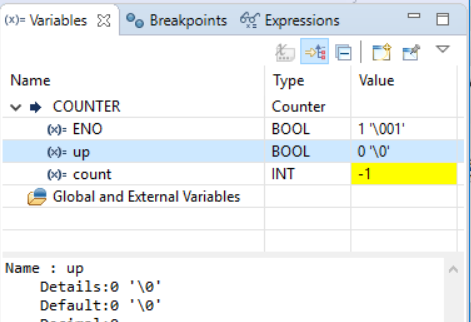
If required, you can change the value of a variable: Double-click the value, enter a new value and press the Enter-key.
For FBD-objects, the view displays the return value of →functions. The name is an internal name that has been automatically generated by logi.CAD 3. Examples for such return values: __6_ADD or __13_SEL. The above example does not contain return values because the illustration has been created for an ST-object.
The section Global and External Variables only contains the corresponding variables of the current POU so that the section is kept concise.
See "Wrong names/data types might be displayed when debugging" for known restrictions.If required, set new breakpoints in the code or disable/skip the breakpoints – see the description under "Settting breakpoints within C-code".
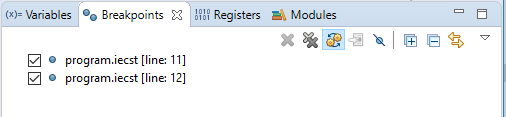
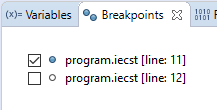
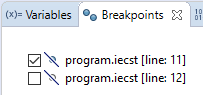
By the way, the Breakpoints view lists all set breakpoints. Example for display:Both breakpoints are enabled:
One breakpoint is enabled, the other is disabled:
All breakpoints are skipped:
If breakpoints from other projects are displayed as well, it is possible to filter the contents of the Breakpoints view by clicking
 (Show Breakpoints Supported by Selected Target).
Afterwards in menu Run, select Resume again and in the Variables view, check the current values of the variables again.
![]() If you want to debug your own application with additional declarations of →POUs, the following commands for step operation might be relevant for you (provided in menu Run and in the toolbar alike):
If you want to debug your own application with additional declarations of →POUs, the following commands for step operation might be relevant for you (provided in menu Run and in the toolbar alike):
|
Command |
|
Result |
|
Step Into |
|
The execution steps into the next C function call or call of the POU at the currently executed line of code. |
|
Step Over |
|
The execution steps over the next C function call or call of the POU (without entering it) at the currently executed line of code. |
|
Step Return |
|
The execution returns from a C function or POU which has been stepped into – in particular to the first breakpoint. |
If a breakpoint is encountered while performing a step operation, the execution will suspend at this breakpoint and the step operation is ended. In this case, ![]() is displayed at the border of the code or
is displayed at the border of the code or ![]() is displayed for the FBD-element.
is displayed for the FBD-element.
When debugging, the execution might not be suspended for each breakpoint that has been set for an FBD-element. This behavior is caused by the optimization of the C-code that is created when the FBD-logic is saved .
Examples for such breakpoints for which the execution is not suspended :
breakpoint for a value field following the call of a string function (e.g. the call of the FIND block)
breakpoint for a value field following the call of a system block that calculates arrays with 2 dimensions (e.g. the call of the SUB_2D_ARRAY block)
![]() If you are using the appropriate keyboard shortcuts for the step operation, do not press and hold the keys constantly or for a longer period of time. If you do, it might not be possible to correctly visualize the processing of the breakpoints.
If you are using the appropriate keyboard shortcuts for the step operation, do not press and hold the keys constantly or for a longer period of time. If you do, it might not be possible to correctly visualize the processing of the breakpoints.